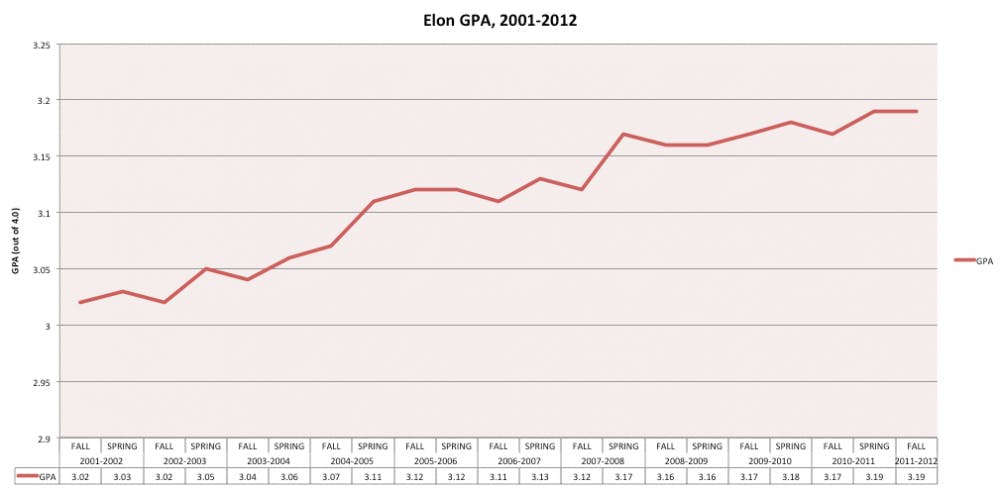
With a new semester beginning, students are seeing plenty of syllabi, enough to probably know what kind of work merits an A or a B. According to the 2011-2012 academic catalog, an A denotes “distinguished performance” in a course, yet, according to Elon University's recent grade distribution reports for fall 2011, the average grade point average is 3.19, significantly higher than the average GPA, 2.37, in 1978, as first recorded by Mark Albertson, registrar and assistant to the provost.
Elon faculty members continue to examine grade distribution to better reflect student performance and intellect.
“When I look at the data about grading, I see compression,” said Peter Felten, assistant provost and director of the center for the advancement of teaching and learning. “Most grades are in a very narrow range and that could be okay if student performance is in a pretty narrow range, but in the classes I teach I see a distribution of students who do really, really well — their performance is amazing — and some students who don’t perform as well.”
This distribution of grades does not accurately reflect the variance in student academic performance, according to Felten. He said he is concerned that grade compression deters the best students from being challenged to do their best work.
“I want students who are struggling to be supported, but I also want them to be challenged,” Felten said. “I don’t want them to feel like they can coast along.”
For several years, Tony Crider, chair of the physics department, has been updating a set of motion charts he created to illustrate the increase in A’s and B’s Elon students have received since 1978. Crider is concerned that, as data indicates, an A is now the most common grade being given to Elon students.
Steven House, provost and vice president for academic affairs, said there are many reasons why the number of A’s and B’s has increased in the past 34 years.
“You have a different faculty, you have a different type of student, you have a different way of teaching,” House said. “By the time you combine all of those in there, you have so many variables you don’t really know what variable is responsible for a change or an increase in a grade. Clearly, students are brighter than they used to be, as demonstrated by the average SAT (score). It’s probably 200 points higher just going on the scale of 1600.”
House said his job is to share the data from the grade distribution reports with faculty members so they know how each professor and department compares